
Built for government & utility districts
Custom Creative · InfographicsInfographics
Essential information, visually captivating — put an eye-popping spin on your data.
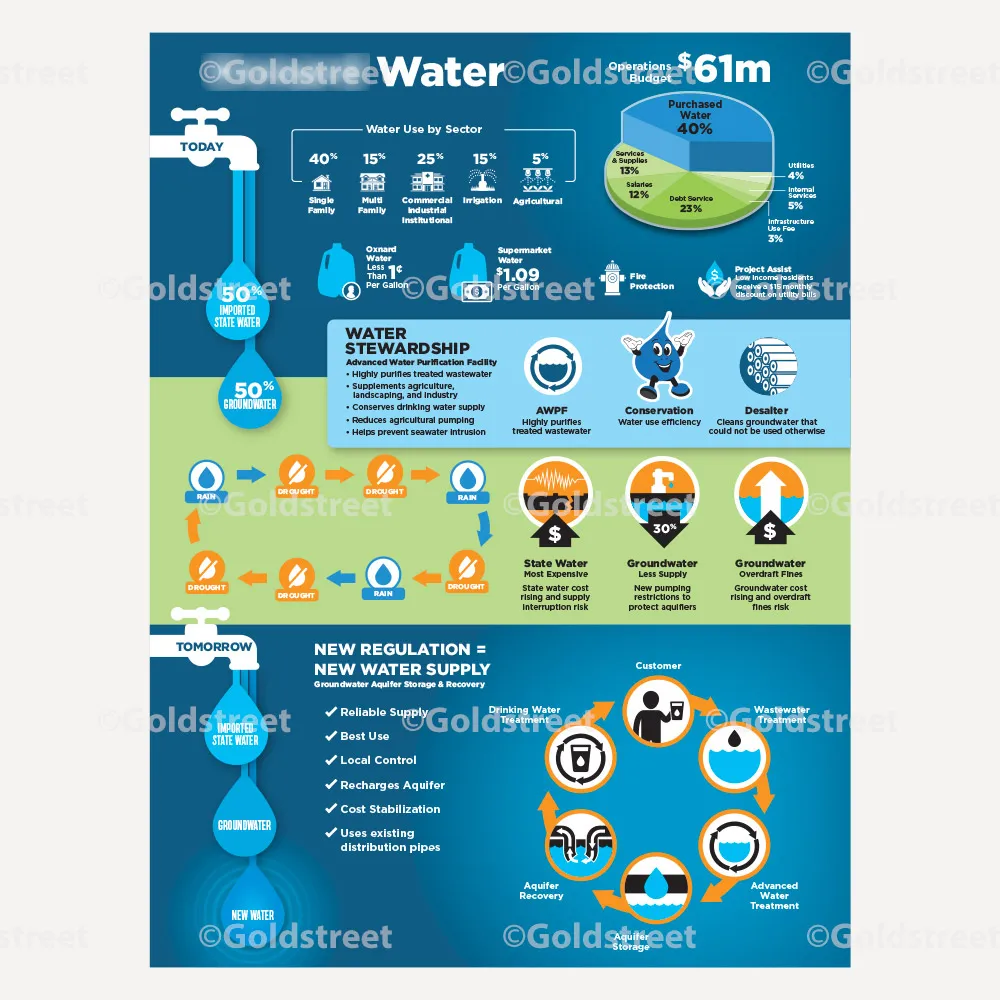
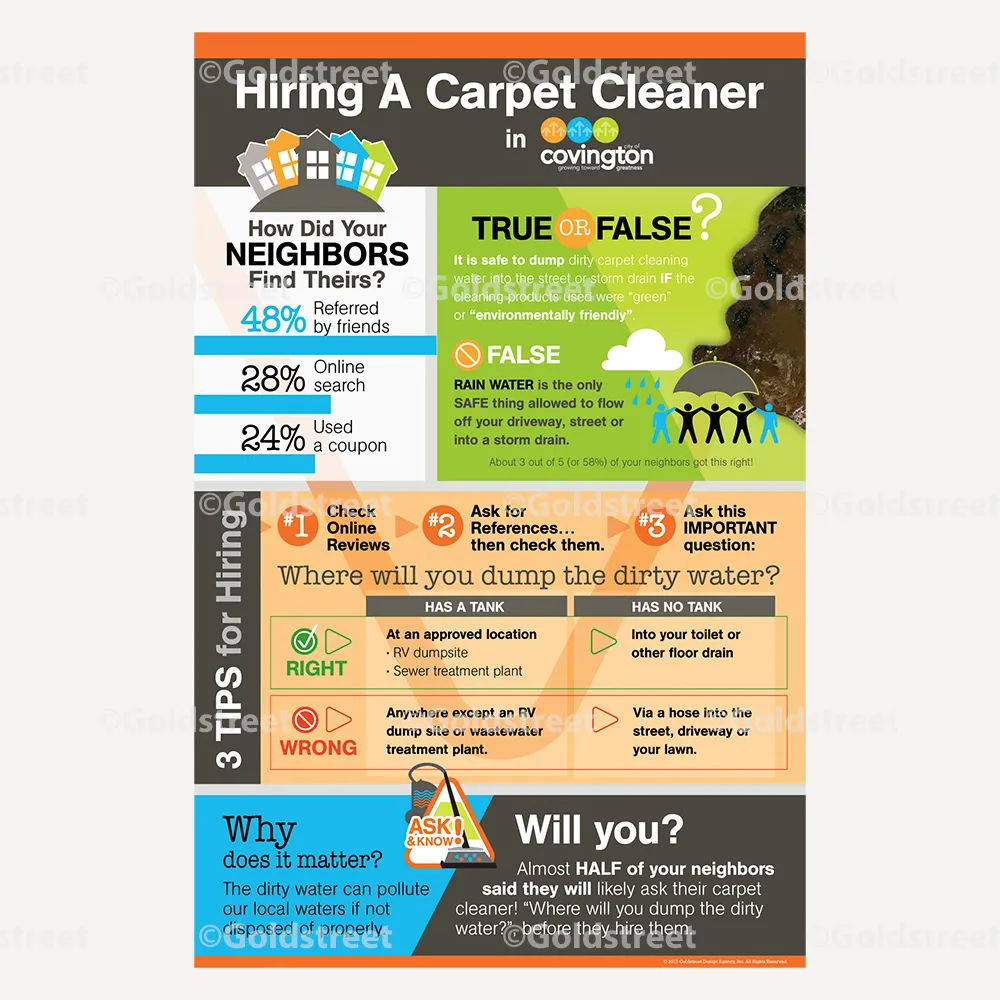
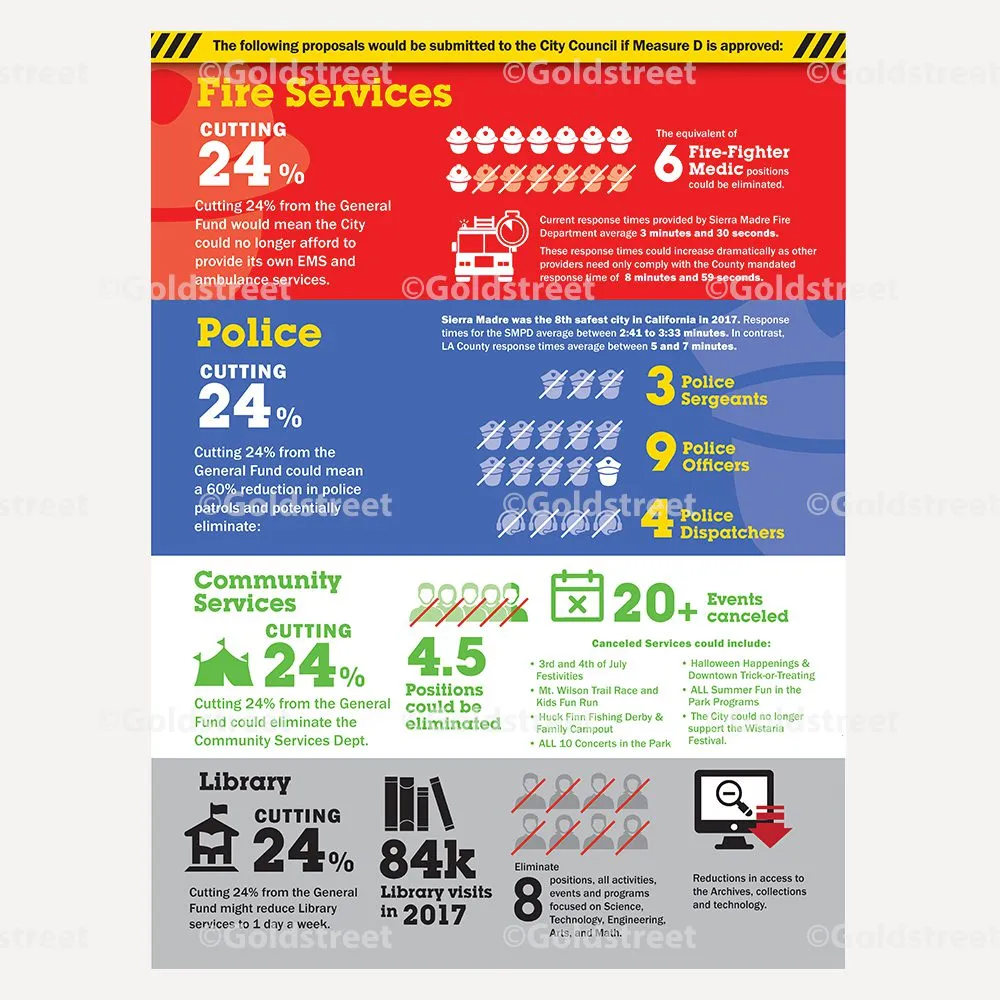
Infographics provide an engaging way to look at boring but important data. Visual aids are proven to better resonate with readers — over 65 percent of people are visual learners. Ensure your important stats aren't overlooked. Our team can help create straightforward print and digital infographics that put an eye-popping spin on your data.
Our team specializes in designing infographics for local government, public works, and municipalities, but can assist with any infographic project.
Essential information, visually captivating.
Related services.
Illustrations
Custom technical drawings, characters, and icons — the raw material of great infographics.
Explore illustrationsWater Quality Reports
The #1 place utilities deploy infographics: making CCR data readable.
Explore CCRsConsult, design, deliver.
We have a proven process to reach the goals of your outreach.

Project Scoping
Determine project goals, deliverables, and budget.

Kickoff Call
Introduce the team and have a shared understanding on scope and project timeline.

Content Drafts
Copy is client-provided or drafted by our copywriters.

Creative Reveal
Our team presents the design for your review and feedback.

Wrap Up
Final, approved version is delivered on time and within budget.

Analyze Results
We follow up to make sure the goals of the outreach performed as expected.
Common questions, answered.
Why use an infographic?
Because over 65 percent of people are visual learners. An infographic turns boring-but-important data — rates, system stats, compliance results — into something residents absorb at a glance instead of skipping.
What data works best as an infographic?
Anything with numbers or a process: how your water system works, where rates go, what belongs in which bin, how backflow prevention protects the supply. If you can explain it in a table, we can probably explain it better in a graphic.
Print or digital?
Both — the same infographic can be delivered print-ready for reports and brochures and web-ready for your site and social channels.
Can infographics go inside our existing materials?
Absolutely. Most of our infographics live inside water quality reports, annual reports, newsletters, and brochures — designed to match the surrounding piece.
Get in touch about your project
Tell us what you're working on and a person responds within 1 business day. Or call 866.742.8287 and talk to your project manager.
Rather talk it through? Schedule a 30-minute call with John.